
Statistics are detailed reports on how the resources provided with your account are being used.
1) Go to Tools & Utilities.
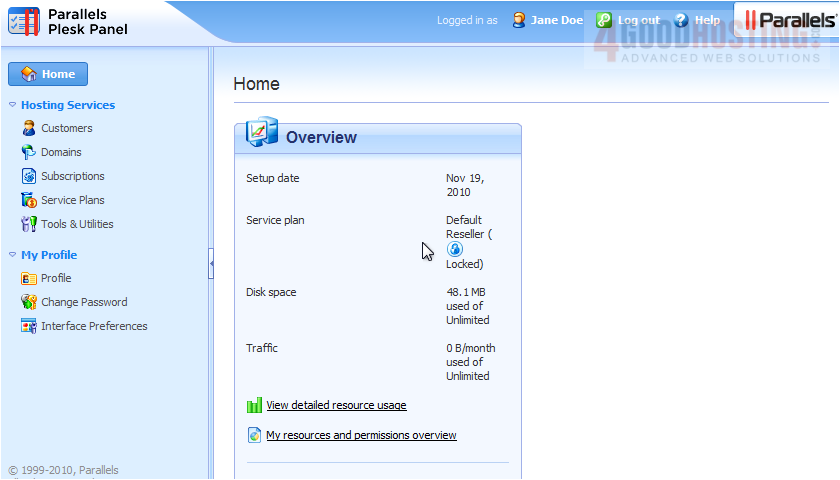
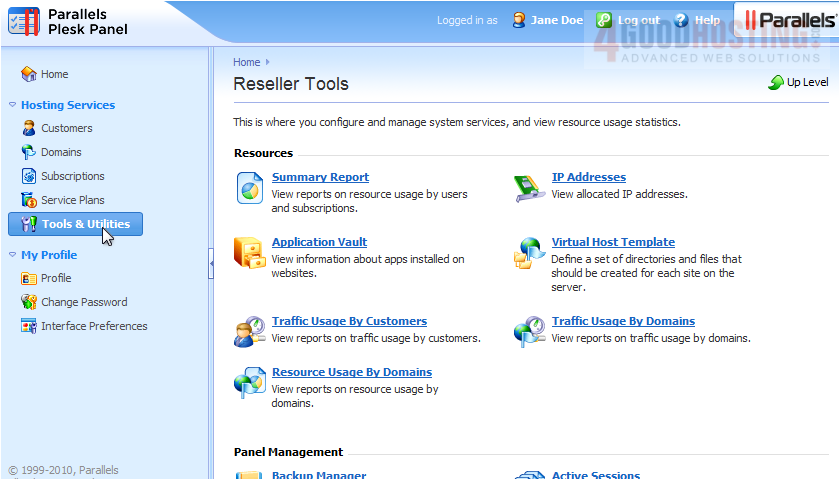
2) Click Resource usage by domains.
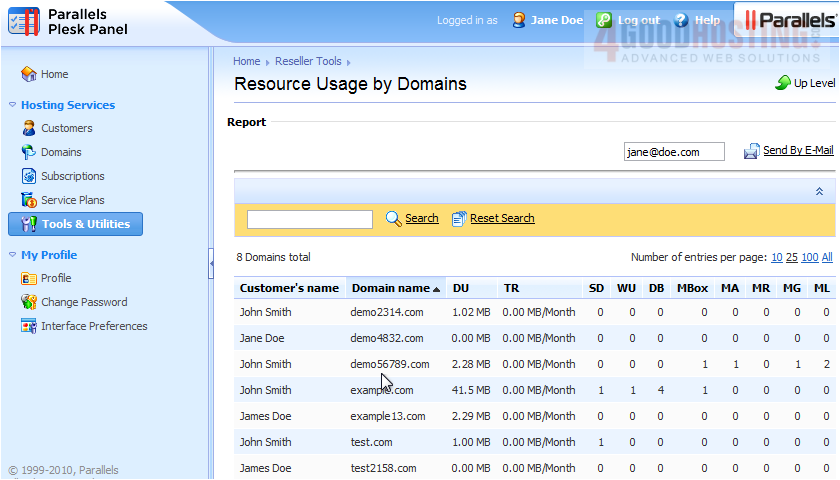
This report shows how much of each resource has been used by each domain.
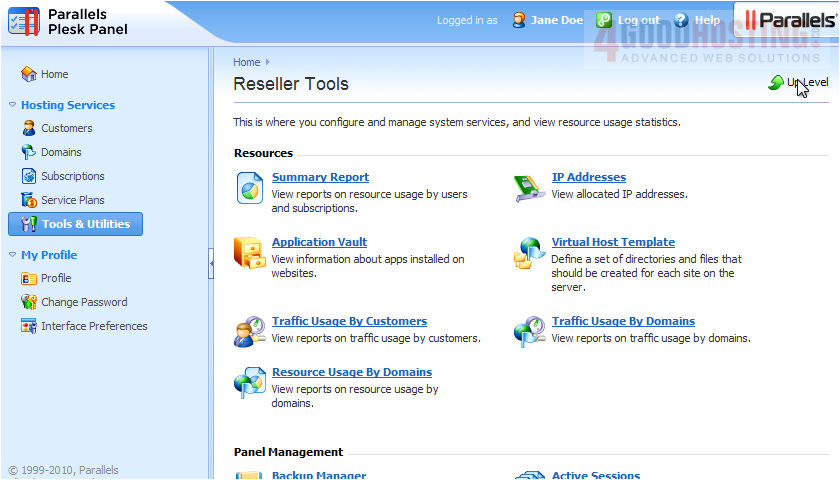
3) Let's go back.
4) Go to Summary Report.
The summary report shows only an overview.
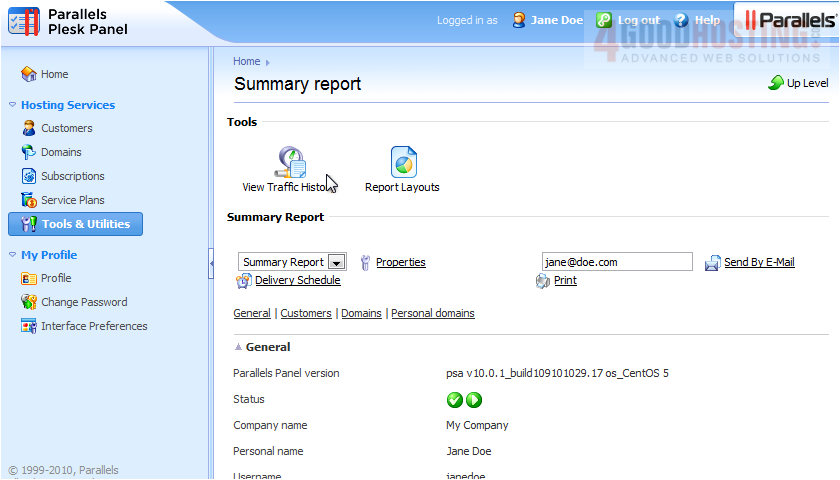
5) We'll view the full report.

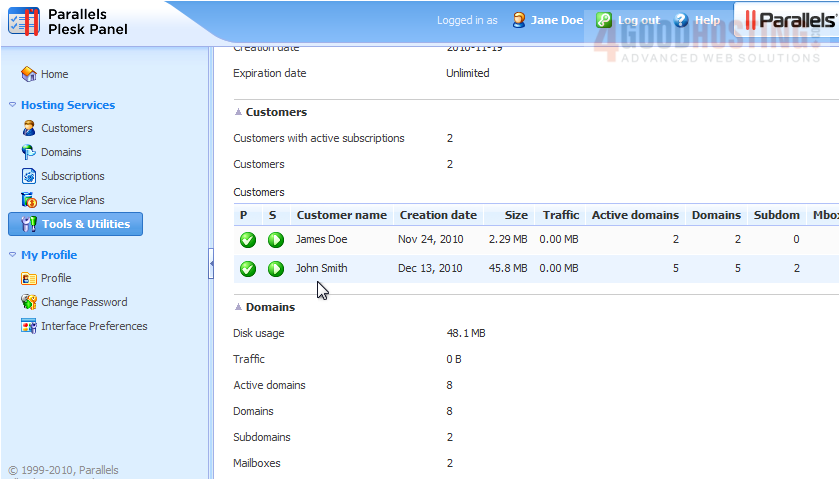
6) Scroll down the page to view the report.
7) To view a summary on bandwidth usage by month, click View Traffic History.
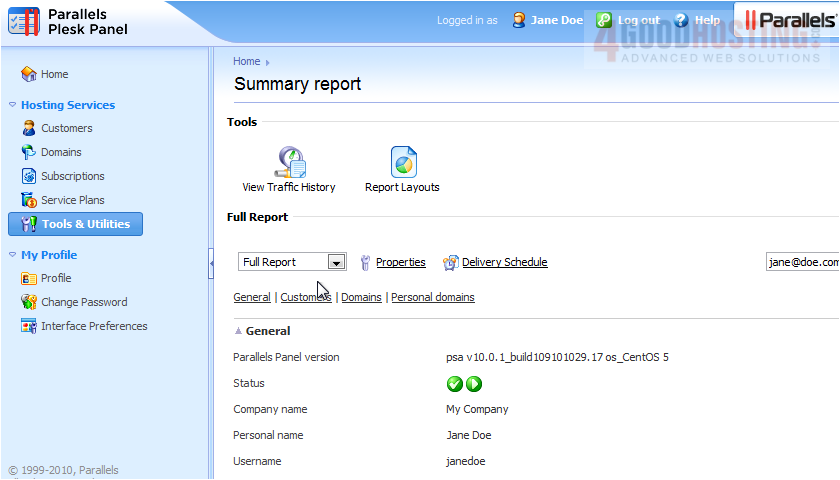
If there are any statistics, they will show up here.

8) Go up a level.
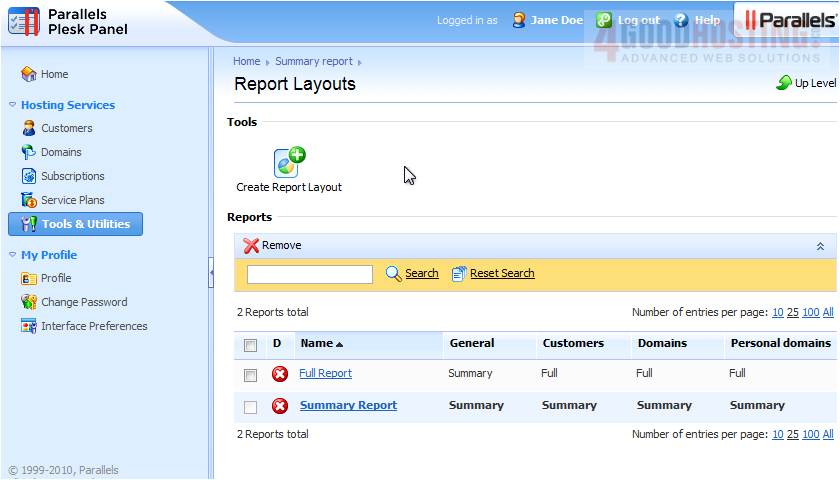
9) To create a new report template, click the Report Layouts icon.
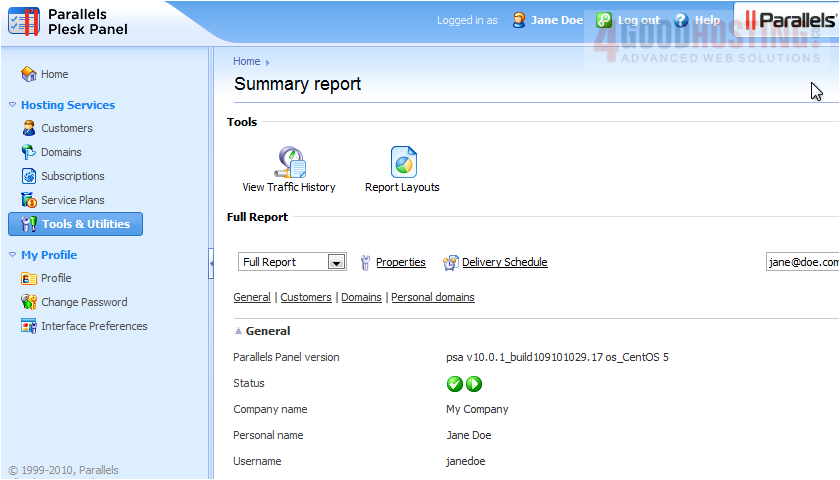
10) Click Create Report Layout.
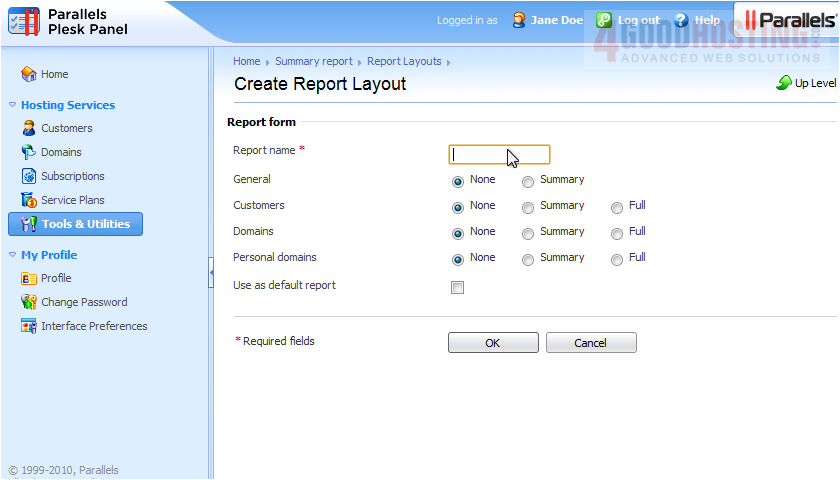
11) Type the report name.
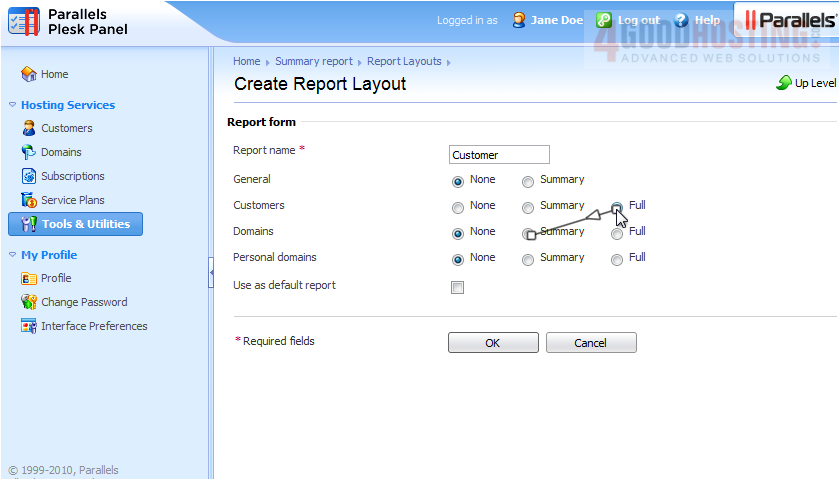
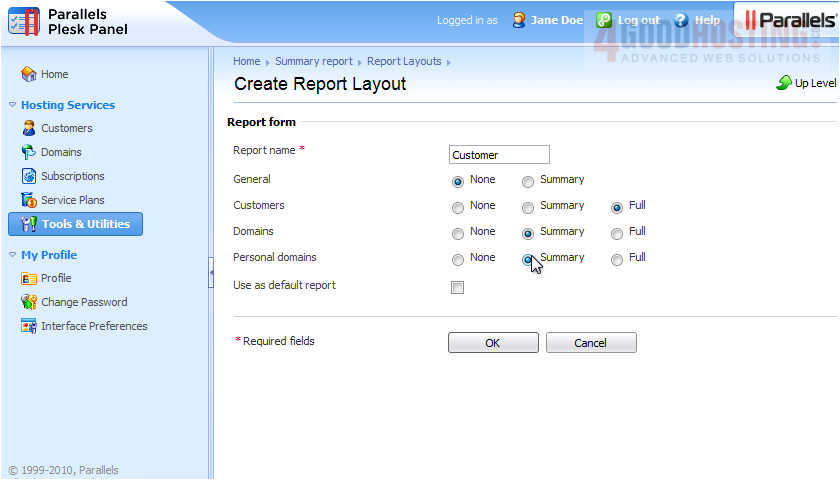
12) Select the type of report to show for each option.
13) Click OK.
That's it! You now know how to view resource usage and statistics.

 WGS AI Assistant