
A new feature in Plesk 10 is Health Monitoring. This is designed to simplify server troubleshooting and let you configure alarm thresholds for automatic notification.
There are five sections indicating the health of the different types of system resources: Services, Disk, Memory, CPU, and Network. Plesk lets you see the health of all of these resources from your Home page.
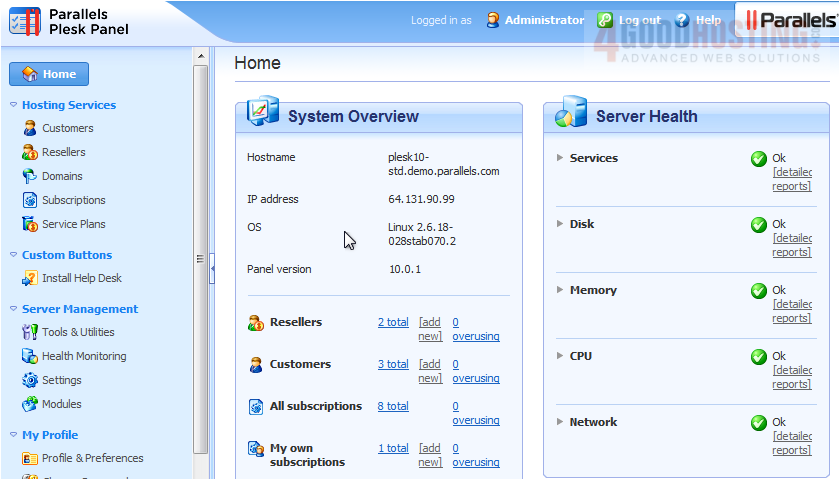
1) Use the arrows to expand the sections and view more information. You can view detailed reports for this section by clicking the Detailed Reports link.
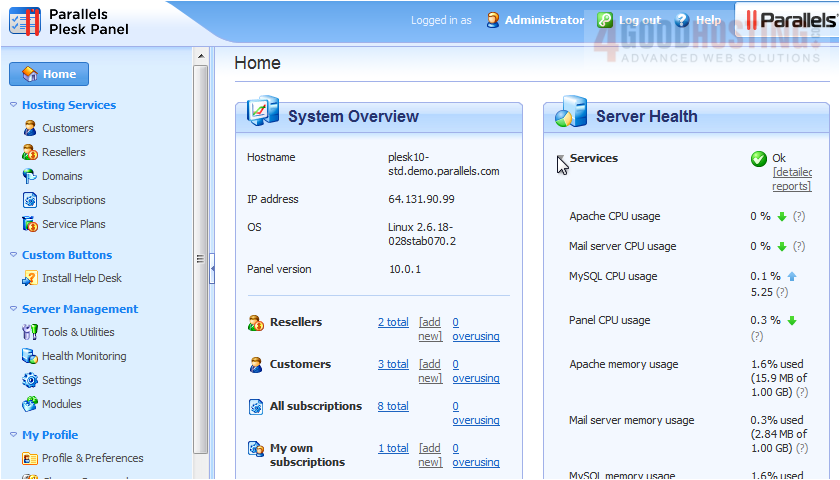
2) ...Or by going to Health Monitoring.
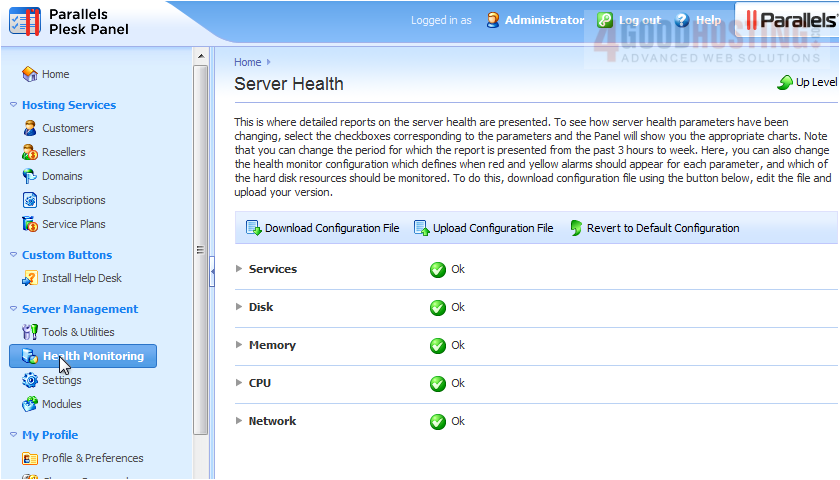
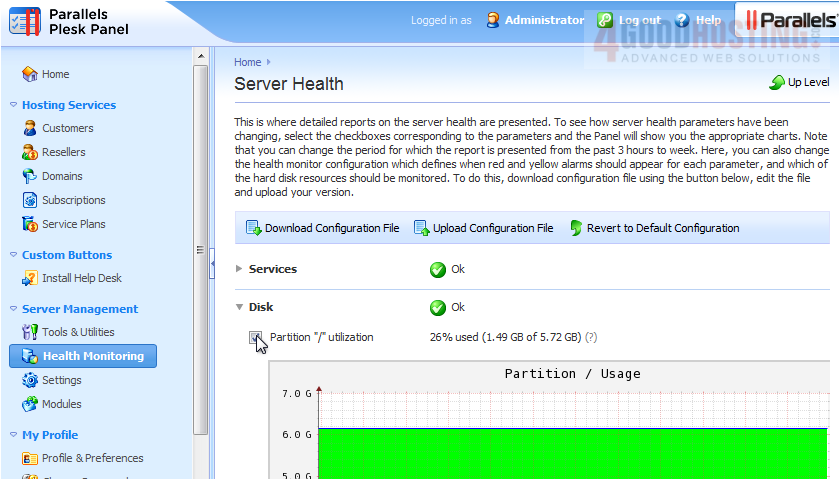
3) Just like on the home page, you click the arrows to expand the sections.
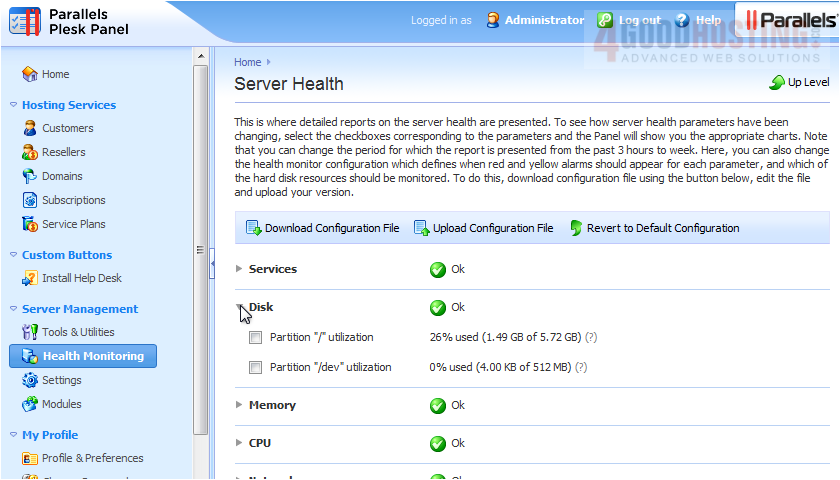
4) Select the checkboxes to view charts related to the parameters.

5) You can define when red and yellow alarms should appear for each parameter and which of the hard disk resources should be monitored by uploading your own configuration file. First, click Download Configuration File to download the default configuration.
6) Make your changes, then upload the new config file by clicking Choose File.
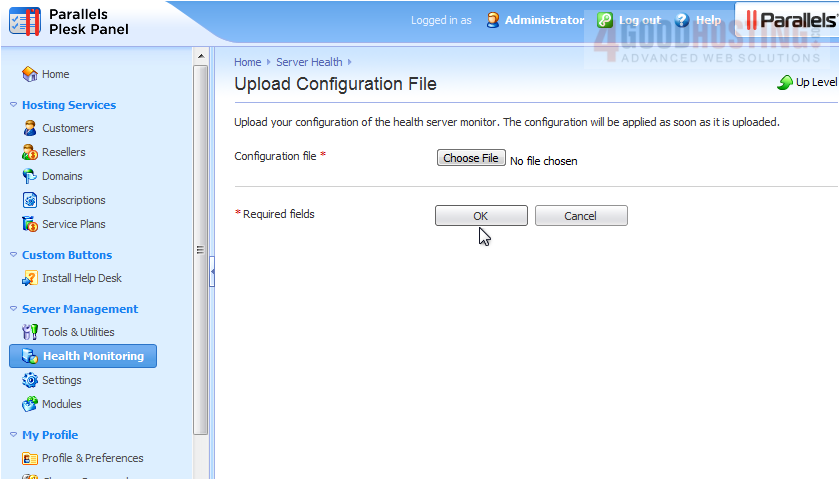
7) Browse for the .xml file.

8) Click OK.

The configuration file was successfully uploaded and applied.
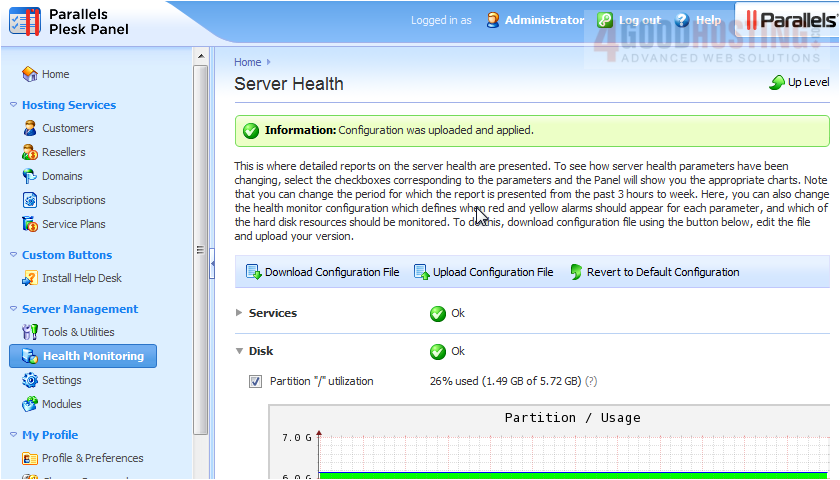
That's it! Now you know how to view and configure your server health reports in Plesk.

 WGS AI Assistant