
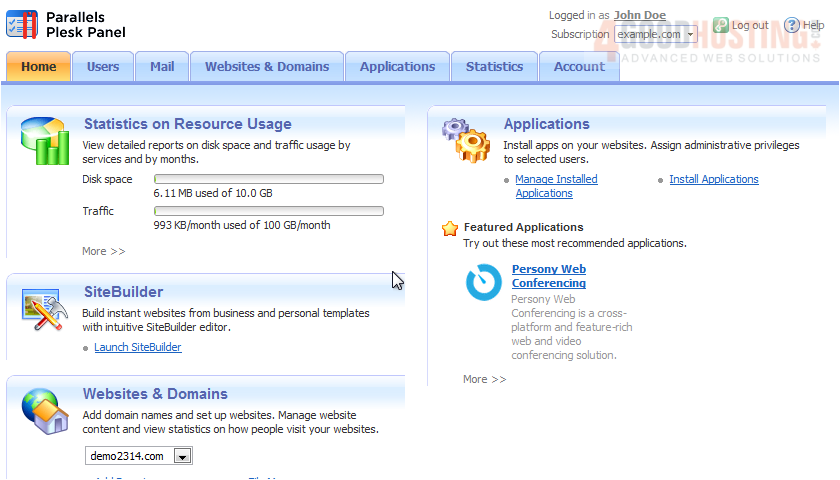
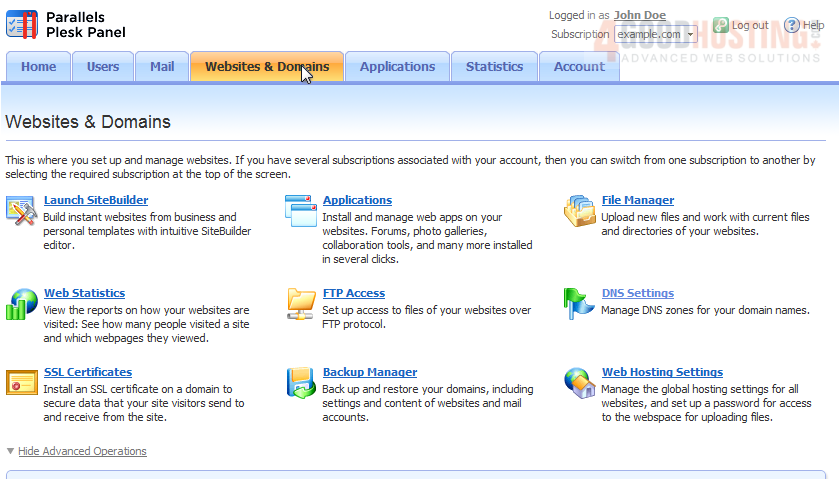
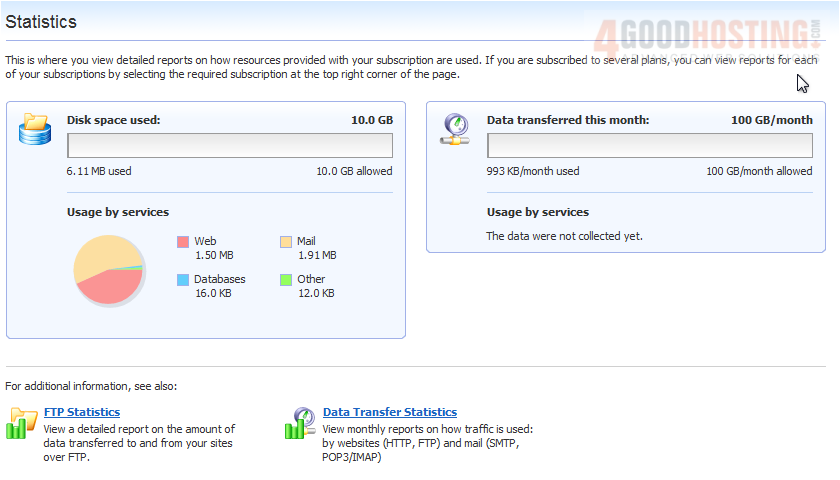
1) Statistics are detailed reports on how the resources provided with your subscription are being used.>The first place you'll see Statistics is on the home page. Here you can see your current Disk space and Traffic usage. Now go to Websites & Domains.
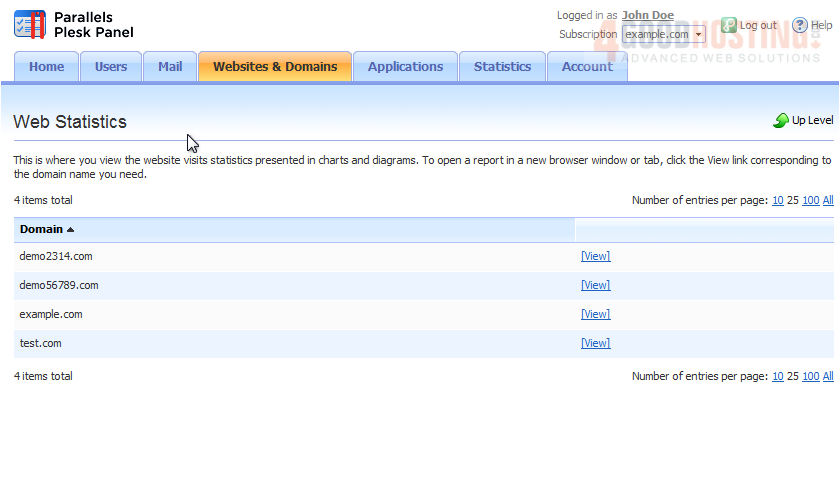
2) Click Web Statistics.
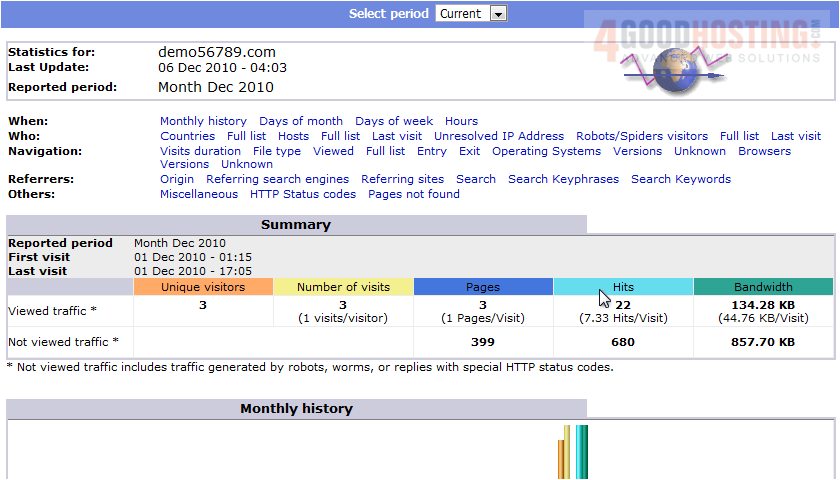
3) Click the View link that corresponds to the domain name.

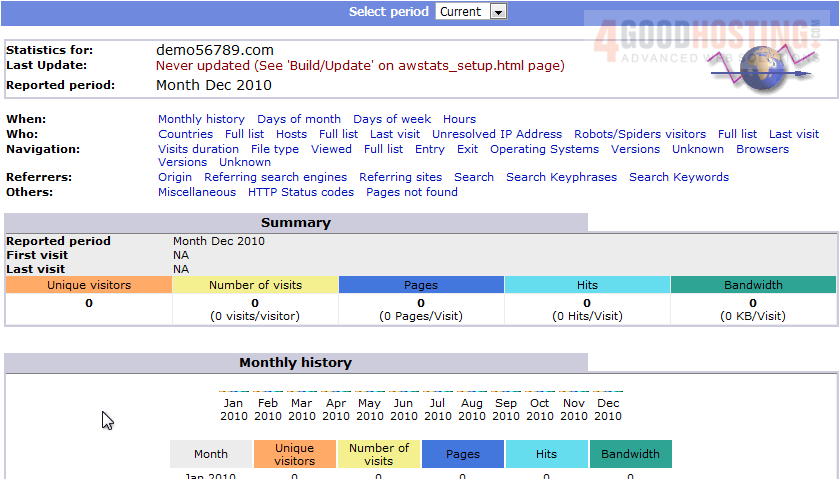
Here are all the stats available for this domain. Use these links at the top to jump to specific stats.
5) Next, go to the Statistics tab.
6) This page shows the disk space and bandwidth usage for the current subscription. Click Data Transfer Statistics to view monthly reports on how traffic is used by websites and mail.

This page shows statistics for FTP, HTTP, POP3/IMAP, and SMTP services.
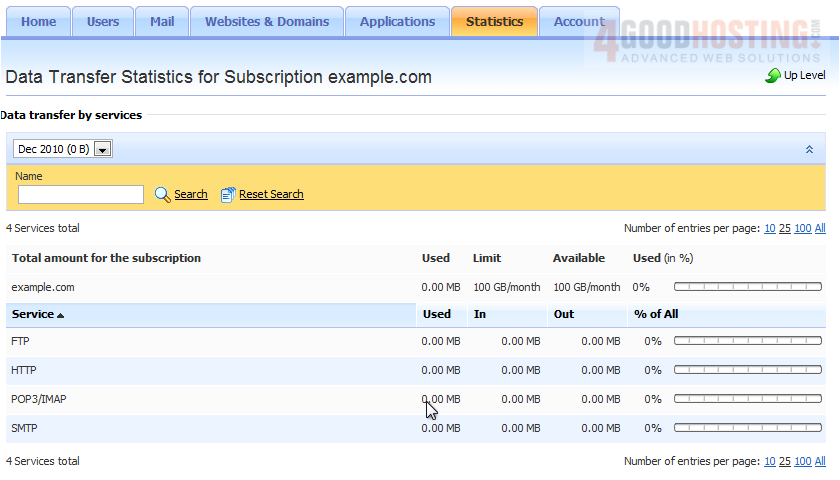
7) Select a different time period here.

8) Click Up Level to return to the previous page.

9) Click FTP Statistics.
Here we see a detailed report on the amount of data transferred to and from our site through FTP.
This is the end of the tutorial. Now you know how to view statistics for your websites in Plesk.

 WGS AI Assistant